If you’ve noticed longer lead times, unexpected cost adjustments, or tighter material availability on your current programs, you’re not alone. These challenges are not the result of isolated supplier issues or regional disruptions. They reflect five converging forces that are simultaneously reshaping the global electronics supply chain in 2026. As your manufacturing partner, we want to be transparent about what is driving these pressures and how we are working to protect your programs.
The AI Buildout Is Consuming the Supply Chain
The most significant driver of current disruptions is one that most electronics buyers did not see coming: the explosive growth of artificial intelligence infrastructure. Global big tech AI capital expenditure is on track to reach $650 billion in 2026, an increase of roughly 80% from the prior year. That investment is flowing directly into semiconductor fabs, PCB laminate facilities, and specialty metals markets that your programs also depend on.[^1]
The ripple effects are broad and measurable. Worldwide semiconductor revenue grew 21% in 2025, reaching $793 billion, with AI chips accounting for nearly one-third of total sales.[^2] AI server boards use 50-60x more PCB material than traditional servers, and they require specialty laminates and copper foils that are now in critically short supply.[^3] With laminate manufacturers prioritizing high-end materials for AI and data center applications, availability for standard and mid-performance materials has tightened significantly.[^4] Standard FR-4 lead times have extended from roughly three days to approximately four weeks. Advanced laminate lead times have reached 140 days in some cases.[^5]
ICs and Memory Are Harder to Source and More Expensive
The same AI buildout consuming PCB materials is also consuming semiconductor wafer capacity. AI memory chips require roughly 3-4x the wafer space of standard memory, and the world’s three largest memory makers, SK Hynix, Samsung, and Micron, have effectively sold out their highest-performance capacity through 2026.[^6]
This creates a real problem for programs built around standard ICs, microcontrollers, and logic devices. Lead times for DRAM extended to 45+ weeks by December 2025, and prices surged 60-172% depending on product category.[^7] Multiple standard MCUs and logic ICs used across medical, industrial, and defense applications were discontinued in 2025 with limited notice. Finding alternates and qualifying them takes time, and that process needs to start now, not when a shortage hits your production schedule.
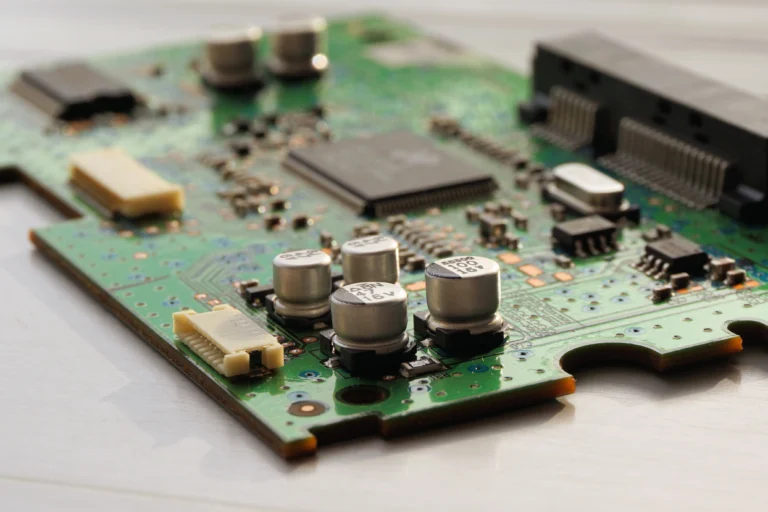
Copper and Gold Prices Are Up Sharply, and Staying There
Every printed circuit board contains copper and, in many cases, gold. Both have reached historic price levels. Copper is currently trading around $12,600 per tonne, up approximately 35% from a year ago, while gold reached approximately $5,050/oz as of early 2026, up roughly 70% from two years prior.[^8]
These increases flow directly into PCB manufacturing costs. NCAB Group, one of the world’s largest PCB procurement specialists, recently reported that laminate suppliers have implemented price increases of 15-25% to PCB manufacturers compared to December 2025 levels.[^4] The effect is compounded for boards with ENIG surface finishes and heavy copper designs. Bank of America forecasts gold will remain in the $5,000-6,000/oz range through 2026, which means this is not a short-term correction.[^4]
Geopolitics and Tariffs Are Fragmenting Established Supply Chains
Tariffs on electronics imported from China reached 145% at their peak in April 2025, before settling at approximately 20% for many categories. That is still a meaningful increase over historical baselines.[^9] Tariffs on PCBs sourced from China range from 25-30%.[^10] A U.S. government survey found that 44% of electronics companies cannot determine whether their products contain chips manufactured in China. That is a significant gap, given that Section 5949 of the National Defense Authorization Act will prohibit PRC-origin chips in government-procured products beginning December 2027.[^11]
These dynamics are accelerating the push toward domestic manufacturing. For VRI’s customers in defense, medical, and industrial markets, the pressure to verify supply chain origin and reduce offshore dependencies has never been greater.
Freight Costs Remain Structurally Elevated
U.S. business logistics costs reached $2.58 trillion in 2024, or 8.8% of GDP, up from the pre-pandemic range of 7.4-7.8%.[^12] Red Sea shipping disruptions have now persisted for three years, with 95% of container ships still rerouting around Africa, adding 10-14 days in transit time per journey.[^13] While container spot rates have moderated from pandemic peaks, they remain roughly 53% above pre-pandemic averages.[^14] Air freight continues to run $5-8 per kilogram on Asia-U.S. routes, making expedited sourcing an expensive last resort.
 How VR Industries Is Managing These Pressures for Your Programs
 How VR Industries Is Managing These Pressures for Your Programs
Understanding these forces is only part of the solution. Managing them requires the kind of supply chain infrastructure and supplier relationships that VRI has been building for decades.
Our approach includes:
- Proactive component monitoring. We track lead time trends and end-of-life notices across your bill of materials, identifying risks before they affect your schedule.
- API-integrated sourcing. Our supply chain management systems connect directly to distributor inventory in real time, enabling faster response when availability shifts.
- Approved franchised distributor sourcing. We source exclusively from authorized channels, protecting your programs from counterfeit risk in a market where counterfeiting increases during shortages.
- Dedicated Program Managers. Your program manager maintains continuous visibility across your in-flight programs and communicates proactively when supply chain conditions change.
- Safety stock programs. Where appropriate, we work with customers to establish strategic inventory buffers that provide insulation from lead time volatility.
These pressures are real, and they are not going away quickly. NCAB Group’s February 2026 analysis characterizes the demand driving AI-related material consumption as structural rather than cyclical, meaning high factory utilization rates are the new normal for the foreseeable future.[^4]
The best time to review your current programs and assess supply chain risk is before a disruption reaches your production line. If you would like to walk through your specific bill of materials and identify exposure points, your dedicated program manager is ready to help.[^4]
References
[^1]: Bloomberg, “AI Chip Manufacturing Demand Creates Historic Shortage,” March 2026.
[^2]: Gartner, “Gartner Says Worldwide Semiconductor Revenue Grew 21% in 2025,” January 12, 2026.
[^3]: PCBWay, “Filling the Gap in High-End PCB Manufacturing,” July 2025.
[^4]: NCAB Group, “PCB Supply Chain Outlook: Strategic Procurement in a Constrained PCB Market,” February 2026.
[^5]: Raymond Goh, COO, Confidee, published by Evertiq, “Global Shortage of Glass Fiber Cloth Continues,” March 4, 2026.
[^6]: SHI Insights, “The Impact of the 2026 Memory Shortage on Data Center Buyers,” February 18, 2026.
[^7]: Sourceability, “2026 Semiconductor Industry Market Outlook.”
[^8]: NCAB Group, “PCB Supply Chain Outlook,” February 2026; BullionVault, “Record Gold Price Ends 2025 Up 65%,” December 31, 2025.
[^9]: Tax Foundation, “Tariff Tracker: 2026 Trump Tariffs & Trade War,” updated ongoing.
[^10]: Matric Group, “Tariffs on Electronics from China: 2025 Guide.”
[^11]: U.S. Bureau of Industry and Security, “Public Report on the Use of Mature-Node Semiconductors,” December 2024.
[^12]: CSCMP 2025 State of Logistics Report.
[^13]: DocShipper, “Red Sea Crisis Update,” December 2025.
[^14]: Drewry Supply Chain Advisors, World Container Index, March 19, 2026.